Uninitialised Ramblings
Tom Haygarth's Programming blog
Debugging a Native iOS Unity plugin
Context
I thought I’d kick this new blog off with a little tutorial that I hope would be useful. I was working on a little native iOS plugin for Unity and needed to do a little debugging of the static library I had built for it and thought it might be a useful tutorial for someone.
Also I’m writing this to be accessible to most people programming with unity and will be making the assumption that this may be their first native library plugin. If you’re familiar with writing native libraries then you can probably skip the first step.
Tutorial
Step 1 - Build a debug version of your plugin
First thing that will need to be done is to build a debug version of the native library your plugin uses. To do this open the xcode project and select the the build target in the top left of the screen
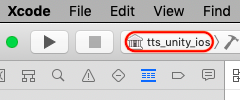
and select the edit scheme option.
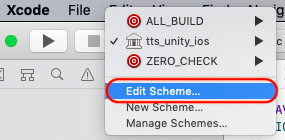
In the edit scheme window set the build configuration option to debug.
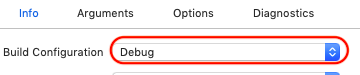
After setting the option, hit the close button and then build a new version of the library. Once the build completes replace the native library file in your Unity project with the newly built debug version and build your Unity iOS game as an Xcode project.
Step 2 - Attaching the debugger
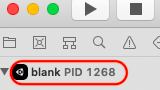
Open up the exported Xcode project for your Unity iOS game and hit the run button to build and deploy your game to your iOS device. Once your game is running make sure the debug navigator is showing.

Note down the process or process ID (PID) of your game.
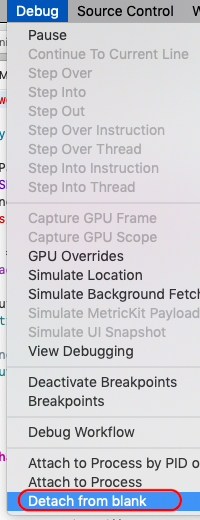
To debug your library from its Xcode project you will first need to detach the debugger from the game’s Xcode instance. To do that select the Debug -> Detach from game option from the toolbar
Next open up your Xcode project for your native library and set deployment device to your iOS device.

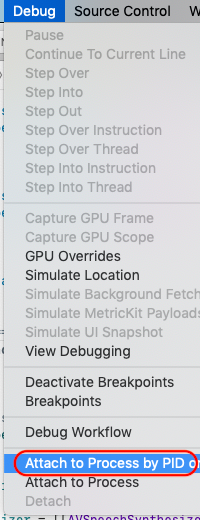
Once you have the device selected you can then attach your project to the debugger by selecting Debug -> Attach to Process by PID or Name.
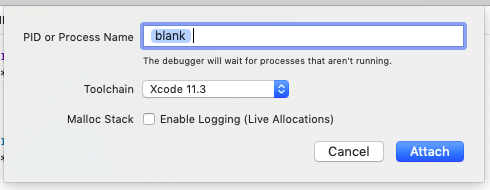
In the dialog that opens type the name of the game process or PID that you recorded earlier and hit the Attach button.
Step 3 - Debugging
After a minute or so your debugger will attach and now you will be able to place breakpoints in Xcode and hit them whenever your unity game code calls your native plugin code.
Step 4 - Conclusion
Hopefully this tutorial is helpful to someone who might be writing a native Unity plugin for iOS. Just don’t forget to replace your debug native library with a release one when you’re planning to release your iOS game or Unity Plugin. You can do that by following Step 1 but instead setting the Build Configuration to Release instead of Debug.
Enjoy your Debugging :)